‘Nothing About Us Without Us’: How GEC Creates Data for Inclusion
A guide to the GEC’s commitment to participatory action research written by Founding CEO, Dr Nicole Ponsford, and GEC intern, PhD researcher, Niall Brenock (University of Kent).
Including Participant Voices in the Design of Our Platform
At the Global Equality Collective (GEC), inclusion is not an outcome — it is the process itself. From the very beginning, the GEC Platform has been built using an ethical participatory methodology, rooted in the doctoral research of Dr Nicole Ponsford at Bournemouth University. This means that the people most affected by the data — students, staff, and leaders — are active co-creators of it.
Our Platform has been continually refined through feedback from hundreds of school leaders and educators. When participants told us a question, term, or function could be improved, we changed it. This cyclical process reflects participatory action research in practice: plan, do, assess, review or in terms of product design, test, listen, adapt, repeat.
Every feature you see on the GEC Platform has been co-developed with users, ensuring that what matters most to them shapes what gets measured.
To ensure that our Platform was created to the highest standard of participatory action research, collaboration was sought not just with academics from Bournemouth University, but also with those from the University of Surrey, University College London, and the University of Kent. To conduct exploratory factor analysis on the survey items, 298 participants were recruited. An additional four took part but were excluded for having completed the survey in an unrealistically short amount of time. To develop the core staff survey in the participatory manner outlined above, 428 participants outside of education were recruited to pilot the survey. In total, more than 700 participants contributed to early pilots and factor analyses for our Staff Module, making the Platform one of the largest participatory research collaborations of its kind in education.
The UX (user experience) was considered as well as the latest research, participant co-design and the gold standard formed in terms of data for inclusion with our new and award-winning platform.
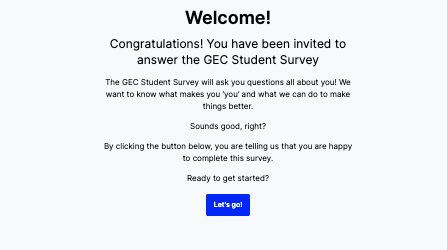
Likewise, the Student Module and concomitant student survey were developed and designed with student participation in mind. Before even being shown any of the content, students were required to click an ‘I’m happy’ [to complete this survey] button which ensured active consent from all students involved. Then an initial set of questions was developed before students from 50 student councils and 7 nurseries reviewed them for relevance and clarity. Their feedback directly informed revisions — removing jargon, simplifying language, and expanding recognition of intersectional identities — empowering us to truly incorporate the students’ voices into every step of the process.
The UNICEF Rights of a Child Framework (2022) and the Information Commissioner’s Office (ICO) guidelines on Children’s Rights in the Digital Environment were further consulted to ensure that, while students’ responses to the survey would always be anonymised, there would not be any safeguarding issues arising from their taking the survey. For example, the student survey limits the number of open-ended textboxes into which respondents can input answers to reduce the risk of sensitive information being shared by students. However, we did not stop at getting student feedback on the survey items but also on their very experience of participation.
This co-design model now extends to GEC Homes, our forthcoming module (2026) amplifying parent and carer voice. Workshops and one-to-one sessions with parents and SENCOs are shaping every stage of development so that the tool reflects real experiences, not assumptions. Few data platforms genuinely include carers’ perspectives — making this a pioneering step towards whole-community inclusion.
Data for Inclusion: A Human Approach to Evidence
Traditional school data often reduce experience to numbers — attendance rates, grades, or behaviour points. Valuable, yes, but they rarely explain why. Our methodology uniquely reframes data as a relationship rather than a product — an idea we call data for inclusion.
Instead of extracting information from participants, we co-create it with them. We also emphasise participatory action research in our data collection. Traditionally, the data acquired from schools and academies has been largely one-dimensional. For example, student outcomes are typically conceptualised either as broad outcomes such as attendance (or truancy), examination scores or behavioural outcomes, or as more individually based scores such as a student’s success in particular academic subjects. However, these traditional approaches often fail to capture the rich narrative experience underlying student and staff outcomes. It is useful to know the average attendance rates for students across the country or average staff satisfaction rates, but it is often more informative to unveil the reasons underlying these metrics. Students might not attend school due to issues of safety, feelings of exclusion, bullying, or social isolation. Staff might feel dissatisfied at their workload, the school culture, or student behaviour. We therefore gather not just quantitative data about student and staff’s attitudes towards EDI-related and mental health-related issues but also invite comments from participants to better understand the lived experiences behind each point of data.

In this way, we adhere to one of the primary aspects of participatory research – the principle of “nothing about us without us”. Respondents are not simply having their data extracted from them with no personal input. They are instead invited to share their voices and to shape how the data ought to be interpreted by school leaders. The ability to provide open-ended responses on each question gives students and staff alike a voice which is often lost in traditional performance metrics like standardised testing or even Ofsted reports.
By combining quantitative results with open, narrative responses, we capture the why behind the metrics: students who miss school because they feel unsafe, or staff who feel excluded by culture or workload. Each dataset therefore contains both evidence and empathy, ensuring that every number has a story attached.
Introducing Kaleidoscopic Data
To bring this vision to life, Dr Ponsford developed Kaleidoscopic Data as part of her doctoral research, Intentional Inclusion: Investigating Equitable Education and Intersectional EdTech (Ponsford, 2025). This innovative mixed-methods framework humanises educational data by weaving together:
Quantitative patterns that show the scale of inclusion gaps
Qualitative voices that explain their lived reality
Intersectional insights that reveal how gender, race, class, disability, and identity interact
Social capital theory, recognising the importance of relationships, trust, and belonging in shaping outcomes
Kaleidoscopic Data is therefore more than a research method — it is a new way of seeing inclusion. It surfaces voices often hidden in traditional systems and highlights the connections that make schools thrive.
The Contribution of Kaleidoscopic Data to Promoting Participant Voices
Kaleidoscopic Data integrates ideas of social capital (the inter and intra-group connections that arise within and between student groups, staff, and institutions) with intersectionality so that consideration is given to the unique ways gender, ethnicity, sexuality, etc can interact to influence how one perceives their school environment. In this way, the Kaleidoscopic Data approach gives voice to all participants, including smaller participant groups who previously might have been neglected in past research and whose experience as minority groups would not have been thoroughly captured by traditional academic metrics such as attendance or academic attainment. Moreover, it does so in a way that respects research ethics throughout, by adhering to ethical protocols established by Bournemouth University’s Research Ethics Committee and those of the GEC itself.
Why This Matters for School Leaders
For leaders, this approach provides ethically grounded, evidence-rich insight into their school community. Each question, metric, and dashboard in the GEC Platform has been created with — not for — participants. This ensures that minoritised groups are not lost in averages, but clearly represented in the story of their school.
By applying data for inclusion and Kaleidoscopic Data, leaders can move beyond compliance and towards intentional, human-centred change. The process transforms data from an accountability tool into a dialogue — one that listens, learns, and acts.
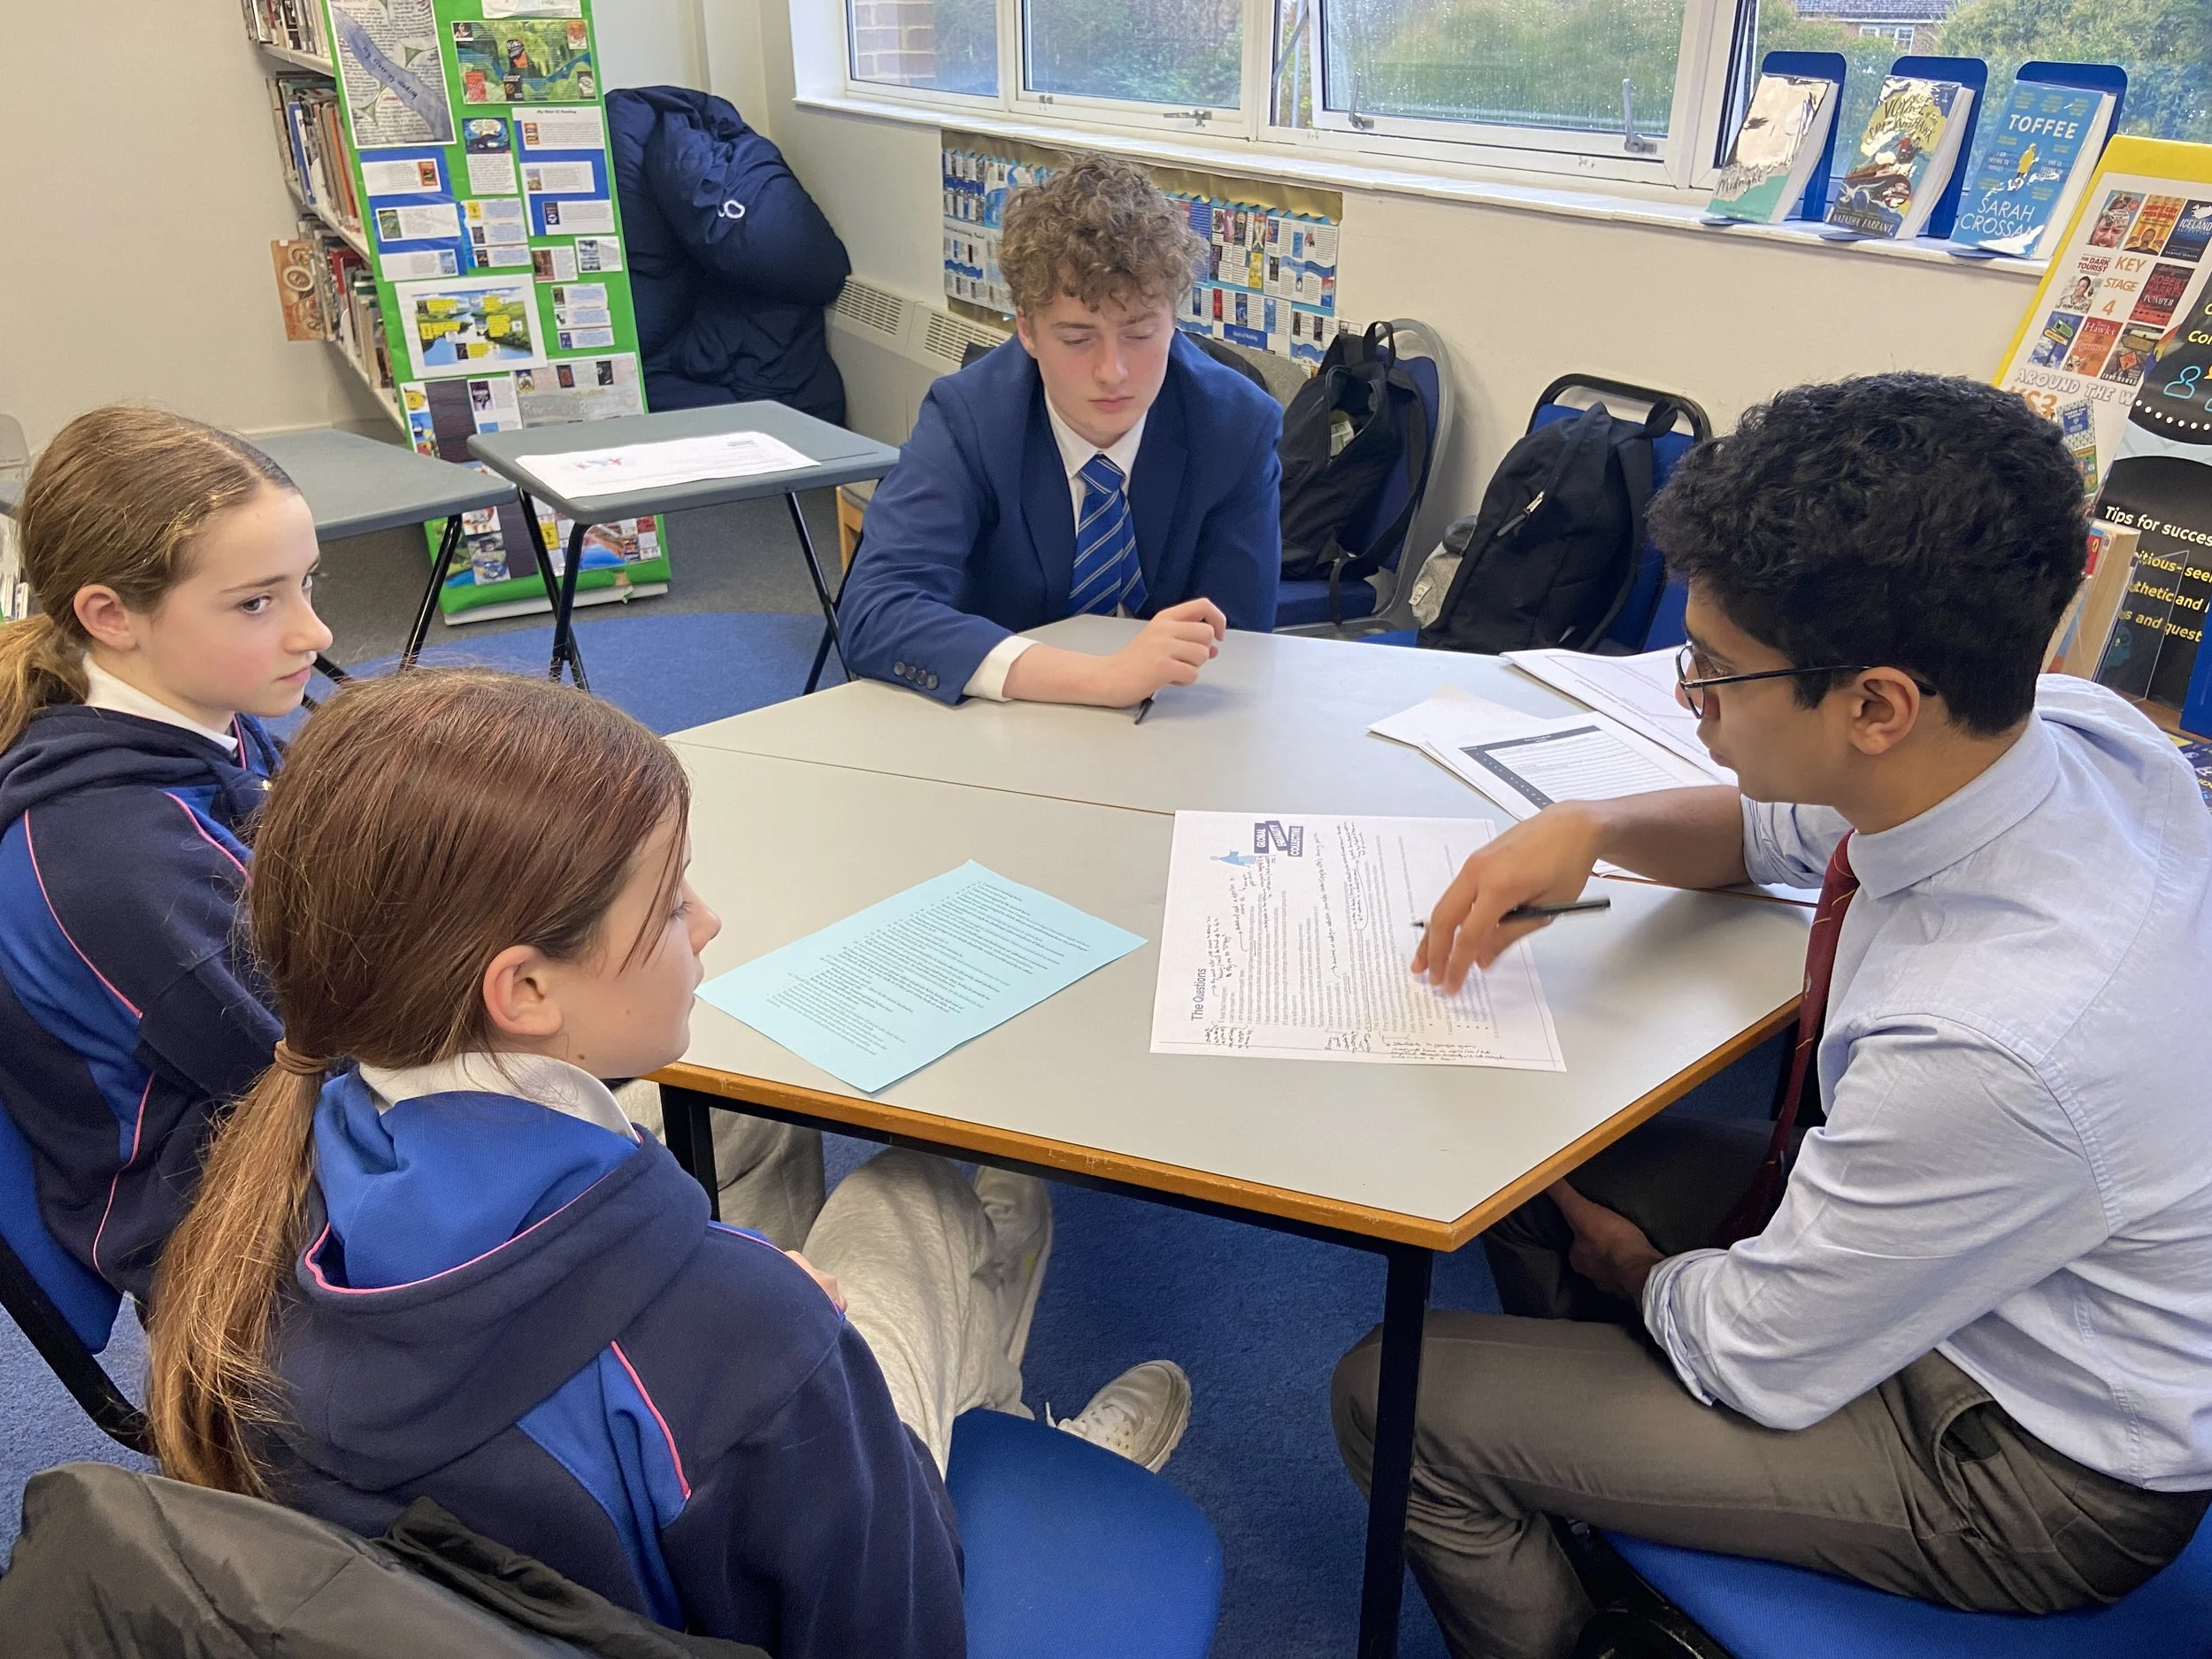
One of our in-person secondary school workshops which brought several schools together to co-design the GEC Student Index.
From Methodology to Movement
Our goal at the GEC is simple: to make inclusion measurable in ways that are meaningful. Grounded in doctoral research and guided by lived experience, the GEC’s methodology ensures that nothing about us is ever without us. Through ethical, participatory design and Kaleidoscopic Data, we’re turning research into real-world impact — one voice, one school, one community at a time.
Let’s Build Belonging Together
If this piece has helped you think about how your school could better engage the voices of students, staff, or parents when designing policy, we’d love to work with you.
To check out our GEC Platform, jump into our virtual demos here.
To delve into our GEC Research, you can access our Inclusion Index and report, ‘26,000 Voices: What Students and Staff Really Think About Inclusion’ here.
📩 Or find out more or arrange a conversation, arrange a live demo, please get in touch:
GEC — office@thegec.education