Taking the Pixels: When Big Data Meets Well-Being

I have spoken at my first intentional speaking event - and WHAT an event it was. Created by a group of data-lovin’ international school teachers, the conference series Data in School is a way of bringing those not only interested but those razor-focused on the how and why of data in schools. I was asked to keynote at their most recent conference, held in the American Embassy School in New Delhi, India, before 75 international school teachers and leaders. Their biggest summit to date - with a focus on Data and Well-Being. And, even more ridiculously, I (organised a military operation for the trinity of chaos then) packed my bags, and went.

I learnt a huge amount from the other speakers, the workshops and the brilliant down time sessions that often involved IPA and the wild buzz of a tuk-tuk adventure. And the result?
After 24 years in education, I now look at data with fresh eyes and I have questions. The main one being are we taking the pixels when it comes to data in schools?
Just because we can collect this data, doesn’t mean we should.
What else can we collect - and why? What is it we are learning from our data?
Is it time to reflect on what we are doing with this data - how ethical is it and how does it support equity?
Is data really therefore working things out for us, or muddying the water?
And so I want to share these thoughts with you. Here are my key takeaways:
What. The. Data? Or, in other words, “Holy Sheets!*”
Pause for a moment.
Consider all of the ways we use data in schools every day.
Quizzes, student performance trackers, registration, standardised tests, ‘grouping’ of students, attendance, performance management - it goes on. Then consider how we do this for every class, how that might differ to other teachers in our department, phase or school. Then across our schools - our regions - and, you get the point.
There is A LOT of data in school.
Schools are all about their data.
The data of other schools and how it compares to ours.
National and international data.
Historical data. Progress data.
Mainly numbers but often words.
We read it, create it and discuss it.
Then we review it and do it all again.
Love it or hate it, schools are all about data. And this data packs a punch.
We move the spicy hot creativity of our students’ ambition into cold, static data. We then create funnels for this ambition, subject pipelines, pastoral care interventions, parent/teacher meetings, it can even dictate which adults and teaching experiences get put before our students to influence their growth and development - and so eventually - it maps out their life choices and future opportunities. As awesome workshop presenters Priya Ramteke and Faye Fraser of Oberoi International School said ‘ Silent data - loud impact’.
But, when it comes to data criteria in schools, we tend to focus on one or two key areas. And this is what I want to challenge.
Are we ‘taking the pixels’ - are we really using data in the way we should, and are we being lazy and narrow-minded in what we deem important.
Let’s take attendance as one of the most important things we look at in state education - because legally students should attend school, they need to be there to be taught is the reasoning, but we tend not to also equally focus on why they do not attend. If education today was based on stable and equal times and experiences, this might make sense. But we don’t and therefore it does not. We only measure the end result, instead of using data to figure out how we better understand the system from a child-centred approach.
When we build in successful attendance as the foundation within a more student-led system, we have to turn the focus of our data collection to understand why would they attend school?
In other words, the day to day obstacles that our young people experience - either at home or within our school cultures - are not what we map. This is not data.
We live in a time of transformation that is all at once post-COVID, midst the cost of living/ privilege/ employment crisis, severe climate change and a movement against systemic racism that’s never been seen before. Against this backdrop, there is an expectation that schooling has worth to our students, but many often feel they have no sense of belonging there, their future is too bleak, a career so unobtainable, that they don’t/ can’t turn up. Instead of using data to work out how we can architect what successful attendance looks like, we focus on the end result - who turns up - rather than why they cannot. This seems archaic to me. I think we need a new type of dashboard in which to both collect and capture data that tells their narratives, and gives us deep learning evidence of our students. Instead of our most crucial data collection being based on the past, current and predicted grades of our students. This should not be our ‘data’ bread and butter in the education system.
One of the biggest takeaways from the event was that if you ask many teachers what ‘data’ is - they often cite student scores and performative data as the sole definition of what data is.
And, as a consequence of prioritising this one data criteria, when it comes to our time, we spend at least 90% of it on student test scores as the main predictor of a students’ (life) outcomes, (possible lifetime) achievement and (actual) worth - and our teaching of them. Holy sheets!
The grades they get determine how we focus our attention on them - separating their lived experiences from their performance.
This is the data that we have collected for decades - without really reflecting on how this is serving us - and them.
And it’s not just data - it is everything that goes before the child when it comes to learning. We don’t use data to help us unlock the barriers they face, not even what they are passionate about. With a known child mental health explosion, more awareness of cognitive diversity, the stress on our other public services and therefore our families, and a rise in food bank numbers, do we really think focusing on test scores is the way we impact our young people best? Securing subject scores without the full picture of what they are getting right, what obstacles they might have in the way of their learning (see Maslow’s Hierarchy of Needs) and ultimately what we need to do to make education equitable for all of our students.
And, I have a real issue with this.

Images from Khan Market and AES New Delhi - a huge thank you to Megan Kuemmerlin and Bob Elliott at AES for looking after us all so fabulously!
Student Voices Screaming into the Void - Hear me now
As a former teacher, head of department, head of school and examiner, I think we need to flip the narrative. We need data to serve us - to serve our students’ needs and to help us see the potential in our learners.
What about bringing in the bigger (data) picture here? What should we be looking at when it comes to data then?
In one of the conference workshops, well-being was cited as a type of student data that teachers say they prioritise, but don't. And that was the teachers’ point of view. Why?
The first response is that we don’t really know the power of data. We aren’t skilled in what it can do, what we can question and what we could demand it can do for us. In short, we aren’t taught to be data literate as teachers, although we all really should be. It is a skill that is either assumed or thrust on us. And, therefore, there are fat slices of data we are missing when it comes to what is ethical data or data maturity matrices or are we collecting the best data to understand our students’ education here?
Data - and its potential - is not something we often consider, let alone spend time on integrating into our pedagogy, policy and practice. At a time where AI is smacking education in the face, I think as teachers we have an obligation to better understand not only large language models, but the data that AI is able to devour in a blink of a human eye.
Next, we need to understand what data we want to collect, and why, and where it is taking us - at a time where we can use technology to capture the lives of our students, the culture of our school and how we measure the impact we have and the lifetimes that we are impacting upon, shouldn’t we?

Lastly, we often also do not think about the experience of the data from the participant - our young people. This is something that I really geek out about in my research - from the dashboard visualisation of showcasing data back to school leaders (aaahh), to how we move through the data from an ethical point of view (ooohh). How do we really find out about our people? What is submerged and missing from regular data that might actually better inform us?
Anonymous listening campaigns (to equally gain insights and empathy for parties of people), equity-based ethnographies (qualitative immersion in a subculture), “fishbowl discussions” (see image) and shadowing students (and staff, if you really want to know how the ecosystem is working) are all part of putting participants and capturing the voices of your most marginalised, and yet so much of this is skipped when it comes to traditional metrics, but have been built into the GEC Platform.
Which is why I think by questioning first how data works for us - instead of us working for the data - will help us to turn the table on how we better understand ourselves in education.
Measure for Measure - Different Strokes for Different Folks
In one session,by the brilliant Dan Ignarvson and Dave Philip of Intellischools, teachers were asked to name the 5 types of data they prioritise - and why. This was a way to then discuss Data Literacy for Teaching Framework. The choices were:
Attendance
Behaviour
Well-being
Co-Curricular
Teacher Judgement
Academic/ standardised test results
External Assessments
Qualitative Observations
Pastoral Notes
Achievement
This is a difficult task. What would you choose?
It became clear that schools are unsure what data is really important for and to whom - with parents more concerned with well-being and most teachers saying this is important but actually spending all their time on “test scores” and performative data.
We then went on to look at the steps for data collection - what is the order in which we collect data in our schools? Identifying needs and strategic goals come first, then the 4C’s (collection, collating, correcting and cleaning). Next we turn that data into information - but then comes the next step, we turn that information into data. It is this fourth step where the data turns into action and drives our work. And this is the challenge. However, we often gloss over this bit (time + funding + a lack of data literacy awareness blahblahblah) and jump into the next stage of capturing more data and reflections. For me, this 4th step is key - moving from the initial data collection and using that to drive action. We need more time and intelligence on triangulation, the trend discordance and understanding the underlying differences in our dialogues before we move to the next phase.
My next observation was that we don’t normally talk about much more than student performance when it comes to data, and standardised scores, right? However, if you ask any teacher, what is the most important type of data - they say “well-being”. But, which do we spend most of our time reviewing, discussing with our line managers and students… and their parents? Not well-being data. And, THAT is why I created the GEC Platform as measuring culture, diversity and inclusion is not something that is being captured, demonstrated and reviewed - so we invented it in this form - intersectional, awesome front of house user dashboards and a powerful data warehouse at the back with 1.2 million rows of data. (If you would like to discuss this with me, just DM me!)
So, what would happen if we fixated on well-being data instead of attendance - as the two are undoubtedly linked. What would happen if we reviewed how our staff and students had a sense of belonging in our community, classrooms and curriculums instead of progress tests and possible outcomes for achievement in X amount of years time?
Let’s stop focusing on what they get wrong and what we could get right for them.
Because - yes again - these are linked. What if we considered how ‘seen’ in the curriculum, how accessible our texts and learning is to them as much as we did (negative) behaviour…? You get where I am coming from. If we create a child-centred approach to data, rather than the current systems - if we look at what they can get right rather than wrong, we can flip the narrative and open opportunities instead of barriers. We can measure what really matters. We can create ethical and very human data - surfacing up the lived experiences and personal stories that really matter when it comes to serving our students.
Street Smarts

Image from Khan Market, New Delhi
As you may know, I myself am considered ‘street’. I grew up as a (council) estate kid, which, due to school being my safe place, set the wheels in motion for my love of working for those most underserved (as I had been as a young child) from summer playschemes, to teaching to school improvement coaching. However, I had not heard of Street Data before I got to experience the excellence that is Global Equality Collective expert Matthew Savage as my fellow keynote. As he did a 360 on different types of well-being data (book him for a keynote, I am not going to summarise his awesome work!) but it was ‘Street Data’ that stood out for me.
Coined by educators in the USA to better understand equitable education through anti-racist lens, this type of data collection is the third part to our usual satellite data (level 1 - large grain data - think patterns of data for student performance, attendance, general information but requires further investigation) and map data (level 2 - medium grain data - so reading, writing, maths - more focused and individual but not the full story of our students). This level 3, fine grained data, helps us to really see the student. It is not about big performance trends, which are actually deeply flawed when it comes to well-being, inclusiveness and equity. Although level 1 data serves to help schools to make sweeping decisions and changes, they also lack nuance and context - which lead, ironically, to a loss of learning for those that the data is meant to serve. Level 2 data gives us a bit more information, so we can see trends, but does not give us enough feedback to make quick and deep decisions that listens to individuals and gives us the data on our humans, the humanity we are desperate for in our data warehouses.
And this is where our work kicks in. I had not heard of this form of data collection before creating the GEC Platform. We are able to listen to all of the intersectional voices of staff and students (and soon parents + carers - watch this space) in a way that brings the lived experiences of our people into a dashboard, to better understand the richer picture of our cultures, but in RAGed graphs and stunning visual displays - intentional inclusion, giving the analytical advantage to our schools who want to go beyond traditional level 1 and 2 students to equip, empower and educate themselves, putting their underserved voices front and centre.
Matthew and I are about to start collaboration on some research on this topic - so watch this space.
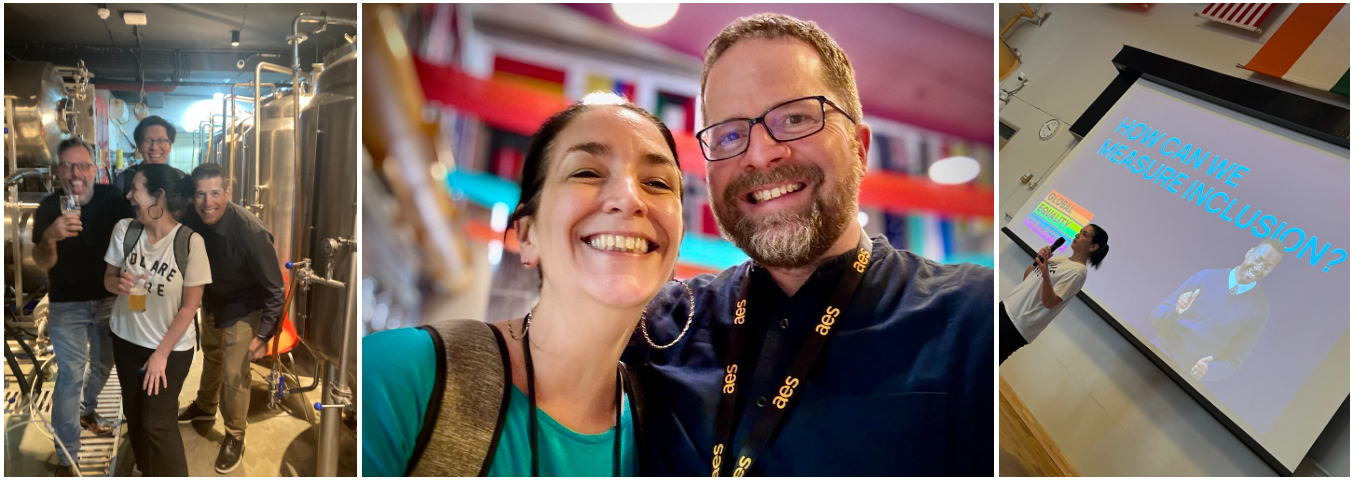
Nic with Data in Schools organisers/legends Chris Smith, Ben Summerton and Andy Sheu. Then with Global Equality Collective expert Matthew Savage (who generously suggested Nic for this event) and keynoting her ‘why’ of measuring inclusion with metrics, the GEC Platform.
Big Data as a ‘Mullet’
This is one concept coined by the Data in Schools team and I love it. Remember (or have you Googled?) the legendary 80s hairstyle of the mullet? Watch this. There are two ways that schools treat data just like a mullet - business at the front, and party at the back.
1) We consider data to be serious, grown up and linked to very VERY serious and important things in our schools - but are often business-designed and led. Cold. Think of the corporations. Think KPIs (key performance indicators) and ROI (return on investment). When it comes to our students, they equate to cells of performance and attainment and attendance. The business of schools. The front of house if you like. But, schools have a different approach to ‘margins’ - and I do not mean the thin blue line that our students write up to. Schools are warm, sweaty messy places of learning, socialisation, aspirations - and care
Bar our traditional paper-based class books, living in margins relates to other and othering ways where our children and young people sit both in and outside of the margins of our schools, and therefore the education sector and then finally our society.
Schools collect millions of cells of data about our students, but I would argue that it is only reach outside of these margins - when we have 3 levels of data - that this really depicts our students and their potential. We need to understand the messy sides of our students that data normally does not measure. The life of the students. Their cultural capital. Their neurodiversity. Their race and ethnicity. The people they live with or away from or who are absent from them. Their privileges and lack of them. The biases that follow them and pre-date their entry into our classrooms. And the way our level 1 and 2 data acts as a barrier to their achievement. The way it can give us a ‘trend’ but not actually see the student who struggles to get into school on time as they are caring for others or not cared for by those who should. They do not show us the diagnosis that might have been missed by other teachers but are seen years after the stereotyping and passing over has begun. They do not tell us why the emotional-based school lack of attendance is the fault of that teacher or senior leader who stung with their words, or the generational impact of that ‘unit’ in school on their parents or the ‘measure’ that broke the back of the effort some young people have to battle just to cross the school gates.
The parties of students, the groups, the subgroups lost in the cells and margins. Data that holds them in thin slices and minority groups. We use corporation style, Westernised (arguably colonised) metrics to represent one aspect of education - without understanding the 360 of their lives, experiences, their lives, their contexts within this data. With ‘Leave No Child Behind’, FSM, PP and SEND acronyms to distance their needs from our offer of an education. We have large parties of students at the back that we do not understand in our data, that our data does not capture - the stories of their every day success against a backdrop of chaotic, being underestimated and unseen. Of being unwelcome and unwanted in the cells and bar graphs on our screens because we are all about the business at hand.
2) Now bear with me on this one. My doctorate research and the conversations I have with data designers and school leaders mean I really understand how big data warehouses are like… mullets. Business at the front - and a party at the back when it comes to the design and user experience of data capture and metrics. When you look at many of the MIS, they are…. Yawnsville to be polite, “government gateway” to coin a phrase. The last thing many dashboards are is cool, beautifully, on trend and give the multi-million pound tech that corporations have a run for their money.
Now, just because you collect data - and you can think of any large spreadsheet, or any dashboard you have, the collection is not where it ends. And that is why I think the ‘party’ element needs to be considered as much as the front end.
95% of teachers do not use dashboards. They are the party at the back. But why?
I often speak to data designers and teachers (not the same thing!) and even if they are the world expert on one side, it is rare they understand the whole 360 when it comes to big data. It is about several parts. Dan at the conference boiled it down to his DLTTF (data literacy for teaching framework):
Identify - what are the strategic goals?
Collect - capture, collate, store, analyse and present
Transform - turn that data into information
Decision - turn the information into data
Evaluate - triangulate, discordance (illustrate the underlying differences)
Data as a Way of Better Understanding - you’ve guessed it - Data
And to finish, when we really start to get under the hood of data literacy, we then need a roadmap. Where is all of this data taking us? Paul Swansen, now member of the Data in Schools team has created a rubric framework for school data self-assessment, which can then guide data strategy planning. Designed to be broadly applicable to both the operational and academic sides of schools (another ‘mullet’ I would argue!) - each category can be disaggregated across different parts of your organisation.

The model was inspired by data maturity models developed by Oracle, Gartner, Dataflux, Kalido, TDWI, IBM, and Stanford University, with the structure and formatting inspired by Cognita’s Digital Maturity Scale. The School Data Maturity Model by Paul Swanson et al is a way of better understanding where you are when it comes to the use of data, where you want to go - and how to get there. A simple needs analysis in theory, but it requires you to think and be smart when it comes to the metrics. And I think every school needs this.
In Paul’s workshop, I was most interested in the ethics of data. As Paul says, this is defined as, “...The use of data to support school values and goals, to build trust among stakeholders, and to be a force for good.” Swanson believes that emotional literacy is needed for data literacy. What happens when we forget the child in the data? What happens when we misinterpret the data? When a biassed teacher tells a marginalised student they got the ‘wrong result’ - they over or under achieved in their view so it cannot be correct? What happens when privileged teachers use data to shame, marginalised students further in “sink classes” or do not see a diagnosis that comes later in a students’ life or data that means students miss out on opportunities to do the best that they could?
Close to my doctorate studies, where I focused on participatory research (how we include the participants in every stage of ‘our’ research) for my pilot study last year, ethical data sits at the core of the work of the inclusion and well-being, and the UX (user experience) of the GEC Platform. I was particularly thrilled to see ‘well-being data’ as part of this, with leading practice defined as:
“Wellbeing, and social and emotional dimensions, are central to the school’s understanding, collection and use of data.”
It is when we look to understand mapping data, satellite and street data, with a huge dose of ethical data and data literacy thrown in, and a data maturity model as our guide, we see that bringing all of these elements together, not only we better understand the need for data when it comes to our staff and students - but that we can frame where evidence-based data will take us to have a people-centred approach. Rather than collecting data for data’s sake, we collect narratives, intelligence and measurements that focus on what is right. We improve our impact and stop taking the pixels when it comes to both our workload, what we prioritise and I think, at the heart, what data should actually be in education.
Takeaways from Data in Schools Conference
If you’re not already following GEC founder Nic Ponsford then check out her profile here.
We exist to help schools build positive, inclusive cultures by empowering them to become Culture, Diversity and Inclusion experts. We’re already working globally with 300+ nurseries, schools, colleges and trusts to make ordinary classrooms extraordinarily inclusive.
Find out more about the GEC Platform: https://www.thegec.education/about-the-gec
(*Edtech legend Sean Forde gets the credit for this data pun)